Validierung von Leistungskennlinien (Englisch)
Zur deutschen Hauptseite | Alle deutschsprachigen Seiten
Checking the Power Curve
The Ce value
A key parameter when checking the power curve is the non-dimensional Ce curve, which can be used for direct comparison of different power curves. If the maximum Ce value exceeds 0.5, the power curve must be assumed incorrect. Ce is the electrical efficiency, meaning that losses in energy conversion of rotor and drive train (gearbox and generator) are included. If these losses were zero, the Ce could have a maximum of 0.6, the “Betz-limit”, where it, mathematically, can be proven that a turbine rotor cannot take more than 60% of energy out of the wind. Theoretically, if the rotor took 100% of the energy out of the wind, the wind speed behind the rotor would be 0 m/s, and the air would disappear behind the rotor. While the rotors are not “ideal”, there will be losses in the drive train, therefore, a Ce of 0.5 is considered an upper limit.
Example of power, Ce and Ct curves from windPRO
Above is an example of power, Ce and Ct curves of a 2 MW turbine with a 90 m rotor diameter. Max. Ce is 0.45 in this example. The example is a turbine developed around 2000. Since then, the standard Ce has increased towards 0.5. This is due to better blade design, more efficient control systems and drive train solutions, and the use of permanent magnets in the generators. The most important issue in turbine design, however, is still the Cost Of Energy (COE), and the highest Ce might not mean the lowest COE. So, even if it was possible to go above a Ce of 0.5, it probably would not bring down COE – at least not with present technology options.
HP/PN-check
Another possible method for checking the power curve is the HP/PN method, where HP is the abbreviation for Helge Petersen, first manager of Risø test station for wind turbines, and PN is for the Manager of EMD, Per Nielsen.
Helge Petersen did a comprehensive study around 2000 where a large number of power curves were compared. The conclusion was that grouping the turbines by design/control strategy (pitch/stall and 1-generator/2-generator), and normalizing by specific power, all turbines had identical power curves. This resulted in a set of tables, giving the output per square meter rotor area for the different designs/control strategies as a function of mean wind speed with specific power as a parameter.
Per Nielsen has later taken over the work of Helge Petersen and updated the study with turbines that are more recent and added some experience-based adjustments (see below). The tables are implemented in windPRO, and a comparison tool for checking how a given power curve compares to the standard tables is available.
Example of HP check of power curve
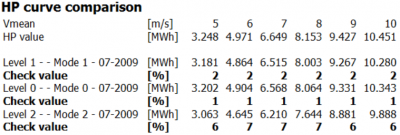
Above is an example of the HP/PN comparison. As seen in this example, the HP value at 5-6 m/s average wind speed matches exactly the power curve value. At 7 m/s, the HP value is 2% higher than the power curve value. At 9 m/s, it is 1% lower. If the deviation is more than +/-3% at a given wind speed, there should be concerns about the reality of the power curve. Note that the comparison is based on Rayleigh distributed wind (Weibull k=2) at standard air density (1.225 kg/m³). If turbines are running in noise-reduced mode, the HP check value tells the loss due to noise reduction. If the non-noise reduced mode has a check value of 1 and the noise reduced a value of 7, the noise reduced operation can be considered to cause a loss of around 6% (see example below).
Example of HP check of power curves with noise reduction
From version 2.4, the HP values have been improved in that WTGs smaller than 150 kW are given reduced HP values based on experience. This means that:
- 50-149 kW: power is reduced to 90% for 50 kW, and, in a linear manner, reduced up to 100% for 150 kW.
- WTGs below 50 kW are reduced to 90%.
- 1 generator, pitch-regulated WTGs are reduced by 4% for mean wind speeds below 7 m/s.
With these corrections, the HP values will be more accurate for all WTG sizes.
From version 2.8, further improvements are made. There are now 5 check tables:
| Stall - 1 generator |
| Stall - 2 generator / variable |
| Pitch - 1 generator |
| Pitch - 2 generator (updated 2012) |
| Pitch - variable speed (new 2012) |
NOTE: When using the HP check it is VERY important that the field in the turbine catalogue called “Generator type” is correctly filled. From version 2.8, the 2-generator and variable speed means two different check tables. The “variable speed” version reflects more the 2000-12 generation of modern turbines with inverters to control the rotor speed, while the “2-generator” version is more relevant for older turbines.
The updates are based on comprehensive analyses by Per Nielsen, which was based on 23 reasonable, new power curves (2000-12 turbines). These are divided into Specific power classes, analysed part by part (foot, leg, shoulder and arm), and are the basis for establishment of “artificial power curves.” These are then the basis for calculation of the new “HP/PN-table values” included in most recent windPRO versions.
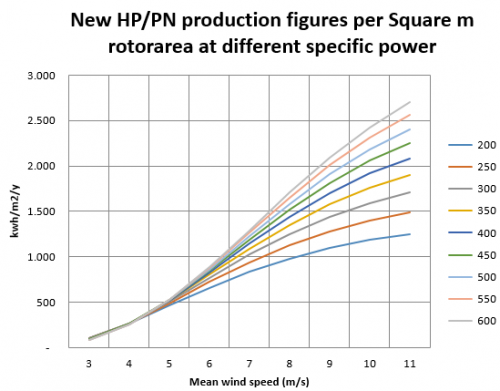
Example of production vs wind speed for generic turbine
Above are the results of the analyses for the Pitch-variable speed, modern 2000-12 turbine. The parameter is specific power in W/m2 rotor area.


