Mesodaten Langzeitkonsistenz (Englisch)
Zur deutschen Hauptseite | Alle deutschsprachigen Seiten
Meso data long term consistency
Long-term consistency using Meso data
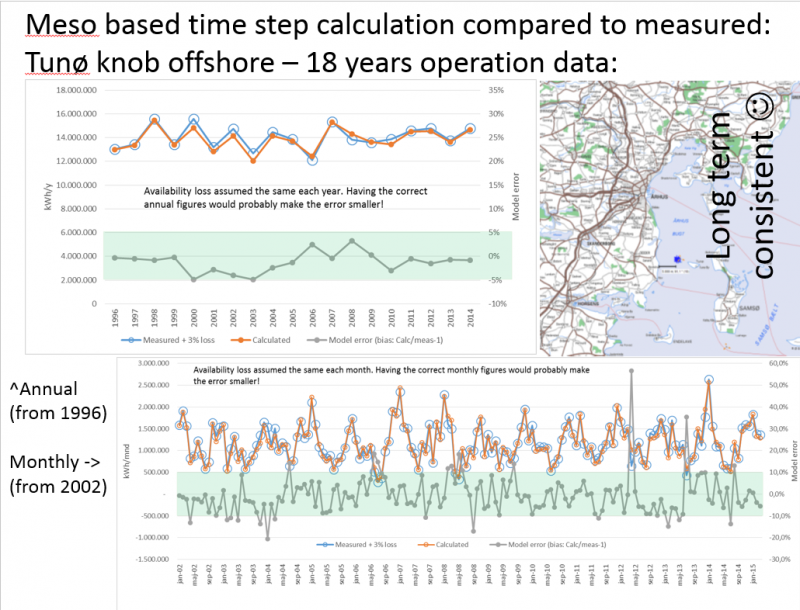
This screen shot shows how well the mesoscale data based calculation matches measured production on a time scale of 18 years. The Tunø Knob offshore wind farm has been operating very well with few problems and a high availability during all 18 years. Therefore, it is a good validation case. It is seen that year-by-year model errors are within +/-5% and month by month within +/- 10%, apart from few months where the problems probably were related to availability issues.
This example alone cannot validate the long-term consistency.
Another test case is Høvsøre wind measurement mast versus MERRA-2 and EMD ConWx:
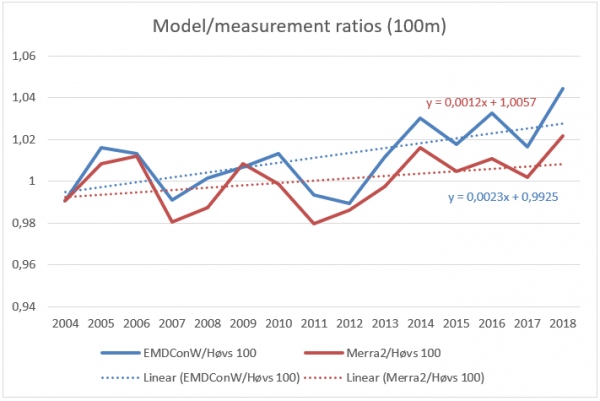
Wind speed rations Model data/measurements 2004-18:
It can be seen as well that the EMD ConWx mesoscale dataset and the MERRA-2 data has a trend relative to measurements.
It is in size order 1-2% per 10 years as an average for this site. What could be the explanations?
- Roughness increase, more trees, buildings and turbines affect the measurements, but not the model data.
- Measurement equipment changes in time, although it is assumed this is recalibrated regularly (?)
- Measurements are never "perfect".
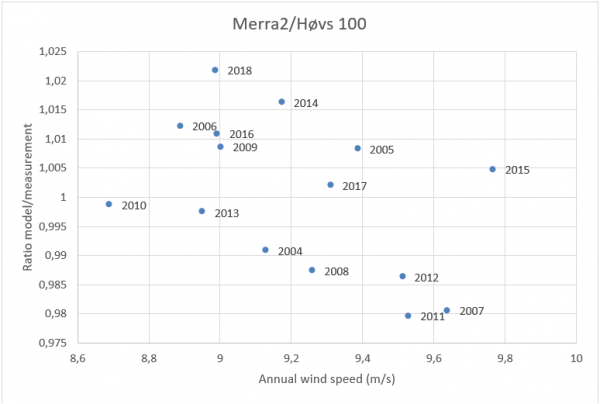
What is certaintly seen is different behaviour in low and high wind years. See graph below:
MERRA2/measurements for Høvsøre 100m (Merra-2 scaled to Høvsøre average)
There is a clear trend, that in low wind years, the model data are too high and in high wind years they are too low. In other words, model data varies less by high/low wind years than do the measurements. This problem can be handled by post processing the model data, something EMD is working on finding good methods to solve.
Later tests have revealed that the seen trend is higher when looking ONLY at eastern directions, where roughness increases in time, and there is basically no trend with wind from west, where the roughness remains constant due to the met mast is close to the sea in west direction. Therefore the observed bias is identified mainly to be increased roughness in time, and is not reflected in the model data.


