Validierung Verdrängungshöhen (Englisch)
Displacement height calculation
Test wind farm for displacement height
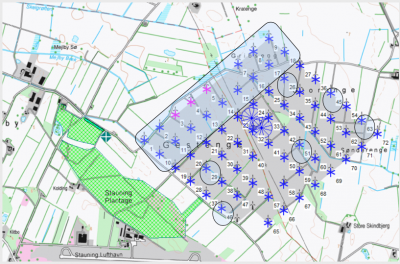
Above is an example of a large wind farm: 67 x 225 kW turbines (31m hub, 29m RD), with a 15 m forest just to the west (main wind direction). This is an ideal test case, except for the production data logging not being very good.
Results of calculation with and without displacement height
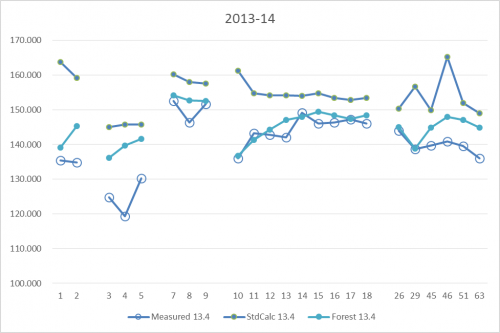
For a shorter period (one quarter), reasonably good production data are collected for the turbines marked on the map in Figure 167 and shown in this graphic. The standard calculation is a calculation based on mesoscale wind data for the same period as the production data. Note especially the turbine row T10-T18. Here, the west most (T10) is calculated as having the highest values due to low wake losses. But the actual production from these turbines is lowest and the production increases towards east. The obvious reason is the influence from the forest. Calculation with the forest model (displacement height calculator) captures the decrease in production very well for the turbines nearer to the forest.
Test of displacement height used for 4000 DK turbines
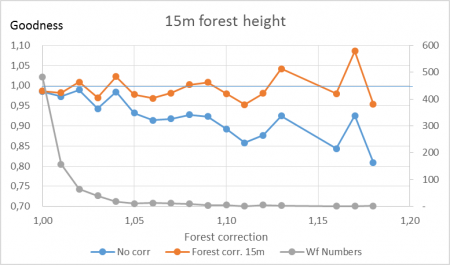
In another example, an analysis was performed for 4000 operating DK wind turbines where calculated results were compared with measured production. The forest concept was tested simply by giving a roughness class of 3 and higher a “forest status”. On the x-axis is how much this corrects the individual wind farms, on average: up to 18% reduction. And, also shown is how the goodness (measured/calculated) is lifted from 80% to almost 100% for most of the influenced turbines. It is obvious that the forest model performs well in improving the goodness of the more forest- influenced turbines, and that it brings the trend closer in line with that of the least influenced turbines.


