MCP-Validierung (Englisch): Difference between revisions
m (Robin moved page MCP-Validierung to MCP-Validierung (Englisch)) |
No edit summary |
||
| Line 1: | Line 1: | ||
{{#ifeq: {{PAGENAME}} |MCP-Validierung|{{Hauptlink}}[[Category:MCP (DE)]][[Category:Validierung]]}} | {{#ifeq: {{PAGENAME}} |MCP-Validierung|{{Hauptlink}}[[Category:MCP (DE)]][[Category:Validierung]]}} | ||
The validation is based on Høvsøre 40m data. Here | The validation is based on Høvsøre 40m data. Here there are 14 years of measurements, so the long-term wind speed is well-known. Data for one year at a time are taken as local data and EMD ConWx mesoscale data are used as reference. Here the years 2015 (high wind), 2016 (low wind) and 2017 (normal wind) are used to see if the long-term expectations are as the long term measured based on these different local years. | ||
[[File:DE_Energy_Validation(43).png|600px]] | [[File:DE_Energy_Validation(43).png|600px]] | ||
| Line 8: | Line 8: | ||
The session overview page with the examples. | The session overview page with the examples is shown above. | ||
Below a table with the different LT predicted mean wind speeds. | Below a table with the different LT predicted mean wind speeds. | ||
| Line 33: | Line 33: | ||
As seen the largest deviation to the true long-term wind speed (14 y) is 0.08 m/s (1,0%). The AEP uncertainty will depend on the | As seen the largest deviation to the true long-term wind speed (7.93m/s over 14 y) is 0.08 m/s (1,0%). The AEP uncertainty will depend on the turbine technology and wind speed level. For this wind regime, the AEP uncertainty will be around a factor of 2 on any wind speed uncertainty The largest error is therefore well inside the estimated uncertainty. It can thereby be concluded that the tool seems to do a good job and that the EMD ConWx data as reference work almost perfect at this site. | ||
For the | |||
For the first entry labelled “2017 Regression”, one year of data is used, therefore the uncertainty is not presented (as windPRO only calculates uncertainty when there is more than twelve months of overlapping data). Expanding 2017 slightly with some data from 2016, gives the uncertainty shown by “Simple scaling” method. | |||
Latest revision as of 17:32, 10 January 2023
The validation is based on Høvsøre 40m data. Here there are 14 years of measurements, so the long-term wind speed is well-known. Data for one year at a time are taken as local data and EMD ConWx mesoscale data are used as reference. Here the years 2015 (high wind), 2016 (low wind) and 2017 (normal wind) are used to see if the long-term expectations are as the long term measured based on these different local years.
More MCP sessions can show more combinations for comparisons
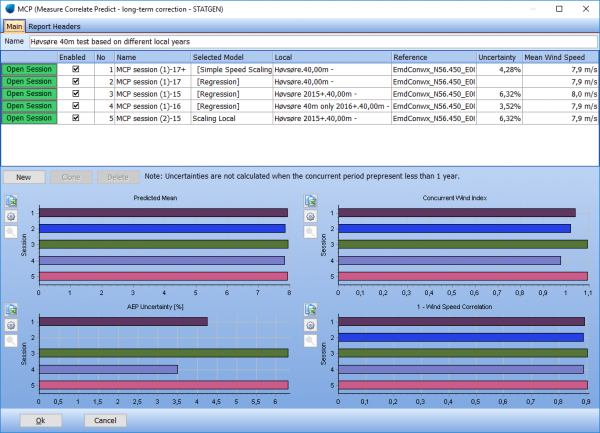
The session overview page with the examples is shown above.
Below a table with the different LT predicted mean wind speeds. Two variants of the 2015 and 2017 based predictions are shown (by cloning the one and changing the selected model).
Below results of the experiments shown in table:
| LT truth: 7,93 | |||||
| Input | Method | Predicted LT m/s | Deviation | Dev.% | Unc. |
|---|---|---|---|---|---|
| 2015 | Regression | 7,96 | 0,03 | 0,4% | 6,3% |
| 2016 | Regression | 7,85 | -0,08 | -1,0% | 3,5% |
| 2017 | Regression | 7,87 | -0,06 | -0,8% | N/A |
| 2017 | Simple scaling | 7,93 | 0 | 0,0% | 4,3% |
| 2015 | Scale local | 7,93 | 0 | 0,0% | 6,3% |
Testing MCP with Høvsøre data
As seen the largest deviation to the true long-term wind speed (7.93m/s over 14 y) is 0.08 m/s (1,0%). The AEP uncertainty will depend on the turbine technology and wind speed level. For this wind regime, the AEP uncertainty will be around a factor of 2 on any wind speed uncertainty The largest error is therefore well inside the estimated uncertainty. It can thereby be concluded that the tool seems to do a good job and that the EMD ConWx data as reference work almost perfect at this site.
For the first entry labelled “2017 Regression”, one year of data is used, therefore the uncertainty is not presented (as windPRO only calculates uncertainty when there is more than twelve months of overlapping data). Expanding 2017 slightly with some data from 2016, gives the uncertainty shown by “Simple scaling” method.
