WAsP-Versionen (Englisch)
Zur deutschen Hauptseite | Alle deutschsprachigen Seiten
WAsP versions modifications
The WAsP model itself will not be explained in detail here (see Risø/DTU WAsP manual), only the changes of high importance for the user in the more recent versions. From the very first versions, until and including ver. 9, the model itself has only changed marginally, and the calculation results, thereby, also. The major improvement during the earlier WAsP model changes is the capability to handle more map file points. However, from version 10.0, model modifications have been made. These mainly relate to stability correction handling, especially for offshore and near shore, but, also, the roughness map interpretation has been improved. The corrections were partly included in ver. 10.0, but first fully implemented in ver. 10.1 and 10.2. We, therefore, do not recommend using ver. 10.0 in offshore or coastal regions. The corrections relate to the default heat flux parameters - the way roughness in a coastal zone is interpreted and to formula modifications. The result of the corrections is a smoother change between on shore and offshore stability correction. The windstatistics for offshore is different if it is generated from WAsP 9 or 10.2+.
This means that an offshore or near shore windstatistics made from WAsP 9 SHOULD NOT be used in any version from WAsP 10.2 or vice versa.
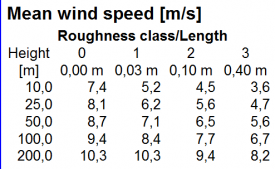
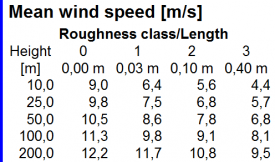
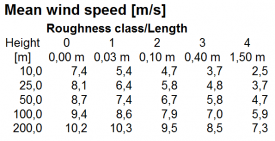
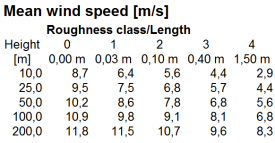
This can best be illustrated by an example: 4 windstatistics are generated from the same time series data:
Image: Four windstatistic results for Lillgrund offshore, different WAsP versions
Top row is using WAsP 9 and bottom row is using WAsP 10.2. Left column is assuming a class 0 site and the right column is assuming a class 1 site.
In the left column, the class 0 data is almost the same using the two WAsP versions. The highest level is at 200m, although the result is slightly lower with WAsP 10.2 – a part of the formula modification. BUT, for the onshore classes, the wind speeds are essentially higher with WAsP 10.2 - around 0.2 m/s.
This means that a WAsP 10.2 calculation could calculate up to around 10% higher AEP than WAsP 9 at an onshore site, if the data basis were offshore.
In the right column, the onshore site, the onshore class data 1, 2 and 3 are almost identical from the two versions. Again 200m has slightly lower results with WAsP 10.2 – a part of the formula modification. BUT the class 0 data is around 0.3 m/s lower when calculated with 10.2.
This means that a WAsP 10.2 calculation would calculate up to around 10% lower AEP at an offshore site, if the data basis were onshore.
The changes are, of course, not serious as long data is used in the same environment it comes from (e.g., offshore for offshore). But, it should be mentioned that, in the coastal region, where there is part water and part land, quite unpredictable changes can be seen. Here, it will be especially important to use the same WAsP version for generation of windstatistics.
From the tables, it is also seen that, with large hub heights (>100m), WAsP 10.2 calculates slightly lower wind speeds than WAsP 9 – this is so both on and offshore have a general modification of the stability correction model. Based on quality test data in an offshore environment and from tall masts, this correction appears to give a better reproduction of the measurements.
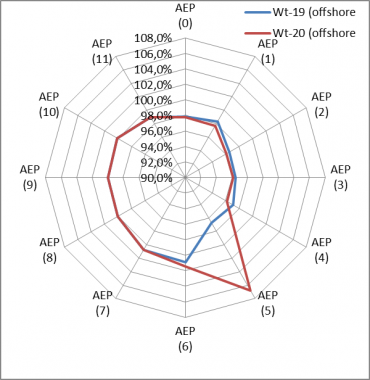
Image: Test case calculations showing the WAsP stability model shift
The example above illustrates the improvement regarding smoothing the stability model shift. Two turbines just 200m apart, both around 4 km offshore, are calculated. In sector 5, there is a roughness change from class 0 to class 0.4 at a 10 km distance. The graphs show the ratio of the calculated AEP between WAsP9/WAsP10.2. Looking at the rose, it is seen that, in sector 5, what happens for the two turbines is very different. This is where the distance to the roughness change in sector 5 is just around 10 km. A change from 0 to a higher class decides that WASP 9 shall change between on- and offshore stability in that direction. The parameter: “Width of coastal zone” decides this and can be changed, but the default is 10 km. It’s an obvious inconsistence, which is in WAsP 9, but not in WAsP 10.2. But, the graph also shows how the calculation results are smaller in general with WAsP 9 when the wind come from land, while the 9 and 10.2 results are the same when wind comes from the open sea.
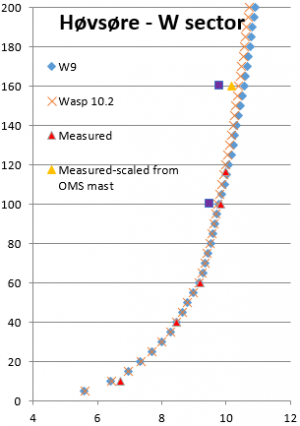
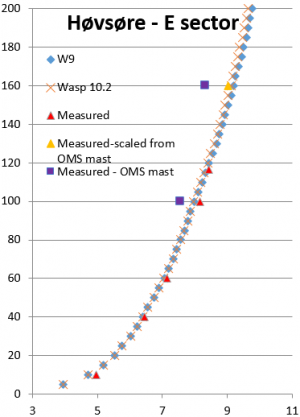
Image: Wind profiles, measured and calculated
A test on reproducing measured profiles in large heights is shown above. It is seen that WAsP 10.2 predicts the vertical profile slightly better than WAsP 9. The 160m points (purple squares) are from another mast nearby and, therefore, not fully comparable to the measured (red triangles). Based on both masts measured at 100m, the 160m point is scaled (yellow triangle), and it is observed that the WAsP calculated profile matches measurements well up to 160m, with a small advantage for WAsP 10.2 relative to WAsP 9.
Tests of calculation in a coastal region with different hub heights
The calculation setup can be seen in the figure on the next page:
Image: Model setup for test of WAsP model
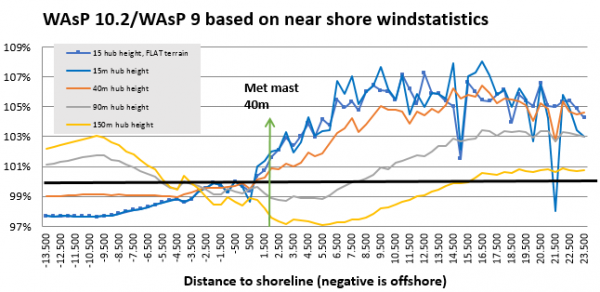
Based on a met mast 1800m from the west coast, a row of turbines are calculated based on the two different WAsP versions, where the windstatistics are generated with same version as is used in the calculation. The turbine row starts 13.5 km offshore and ends 23.5 km onshore.
Image: Map details for test setup
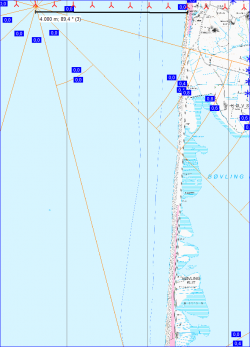
The map gives an idea of the surface roughness around the test row. The row crosses a large forest area along the onshore part.
Image: Results of WAsP 10.2 vs 9 calculations
For a 15 m hub height there is two variants: one calculated without orography and one with. For all other heights, orography is included, and for all calculations, digital roughness maps are included.
It is seen that there are quite some differences between the WAsP 10.2 and WAsP 9 results, but it is not that easy to come to a clear conclusion as to why. Starting with the 150m hub height, WAsP 10.2 results are around 1% lower the first 3 km offshore, but then rise up to 3% higher around 10 km offshore. Onshore, the results are lower the first 15 km, up to 3%, but get then slightly higher. A “reversed” pattern is seen for very low hub heights, but with up to 8% higher results onshore. There is two dramatic peaks in the graph. The leftmost peak is due to differences in roughness interpretation in the two models. The rightmost is due to different orography interpretation. This just illustrates that, besides the major model changes, some minor bug fixes also contributes to the differences and leads to a recommendation to always use the latest version.
In conclusion, there are obvious improvements, and, especially offshore and in coastal regions, we recommend using WAsP 10.2 due to better reproduction of the measured shear. For fully onshore sites (when measurements also are fully on shore) there seems only to be differences when hub heights are > 100m. However, if measurements are in coastal regions, the changes in calculation results can be quite large. We cannot yet say, based on actual turbines, if one or the other models performs better. But the most important conclusion is: Do not use different WAsP versions in coastal regions to generate and use windstatistics!
