EMD Electrical Grid Map: Difference between revisions
| (7 intermediate revisions by the same user not shown) | |||
| Line 1: | Line 1: | ||
[[Category:Online Data]][[Category:Maps]] | [[Category:Online Data]][[Category:Maps]] | ||
== Introduction | == Introduction == | ||
The EMD Electrical Grid Map is built upon the OpenStreetMap (OSM) project, with a specific focus on electrical grid data, which are typically hidden in standard map renderings. The data include many different types of data, e.g.: grid-lines, substations, wind-turbines, power-plants & transformers. To highlight this data, we mute the usual map colors and overlay the electrical grid elements. Where available, voltage levels are also displayed alongside the cable lines. The source data for this map comes from the OpenStreetMap (OSM) project, an open and editable map with global coverage, created and maintained by a dedicated community. For more information or to contribute to the project, please visit the OpenStreetMap homepage. Samples of two selected places in Denmark and Australia are shown in the figure below. | The EMD Electrical Grid Map is built upon the OpenStreetMap (OSM) project, with a specific focus on electrical grid data, which are typically hidden in standard map renderings. The data include many different types of data, e.g.: grid-lines, substations, wind-turbines, power-plants & transformers. To highlight this data, we mute the usual map colors and overlay the electrical grid elements. Where available, voltage levels are also displayed alongside the cable lines. The source data for this map comes from the OpenStreetMap (OSM) project, an open and editable map with global coverage, created and maintained by a dedicated community. For more information or to contribute to the project, please visit the OpenStreetMap homepage. The EMD Eletrical Grid Map is one of two OSM map renderings in windPRO, with the description of the standard rendering available - [[Open_Street_Map|here]]. Samples of two selected places in Denmark and Australia are shown in the figure below. | ||
[[File:EmdElectricalGrid.png|center|thumb|900px|Samples of EMD Electrical Grid Map in windPRO (left: Part of Aalborg, Denmark, right: Victoria, Australia). © OpenStreetMap contributors]] | [[File:EmdElectricalGrid.png|center|thumb|900px|Samples of EMD Electrical Grid Map in windPRO (left: Part of Aalborg, Denmark, right: Victoria, Australia). © OpenStreetMap contributors]] | ||
== Legend and Rendering== | == Legend and Rendering== | ||
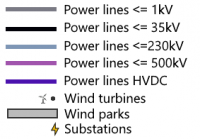
[[File:EmdElectricalGridLegend.png|right|thumb| | [[File:EmdElectricalGridLegend.png|right|thumb|200px|Legend: EMD Electrical Grid]] | ||
Power lines are split into 5 categories, each being shown at different zoon levels. The following rules are used in our rendering: | Power lines are split into 5 categories, each being shown at different zoon levels. The following rules are used in our rendering: | ||
Latest revision as of 10:30, 28 November 2024
Introduction
The EMD Electrical Grid Map is built upon the OpenStreetMap (OSM) project, with a specific focus on electrical grid data, which are typically hidden in standard map renderings. The data include many different types of data, e.g.: grid-lines, substations, wind-turbines, power-plants & transformers. To highlight this data, we mute the usual map colors and overlay the electrical grid elements. Where available, voltage levels are also displayed alongside the cable lines. The source data for this map comes from the OpenStreetMap (OSM) project, an open and editable map with global coverage, created and maintained by a dedicated community. For more information or to contribute to the project, please visit the OpenStreetMap homepage. The EMD Eletrical Grid Map is one of two OSM map renderings in windPRO, with the description of the standard rendering available - here. Samples of two selected places in Denmark and Australia are shown in the figure below.

Legend and Rendering

Power lines are split into 5 categories, each being shown at different zoon levels. The following rules are used in our rendering:
Cables
- Up to 1kV: Shown from zoom level 11 in dark grey
- Up to 35kV: Show from zoom level 11 in light green
- Up to 230kV: Shown from zoom level 5 in light purple
- Up to 500kW: Shown from zoom level 5 in dark purple
- High voltage DC: Shown from zoom level 5 in dark blue
Infrastructure
- Power cables under ground/water is drawn dashed.
- Substations are shown from zoom level 8 as a lightning symbol
- Wind Turbine parks are shown from zoom level 8 as a light grey polygon
- Individual turbines are shown a dots from zoom level 8 and as a turbine symbol from zoom level 12
Usage Notes
- Update cycle: We expect to do yearly updates of this map. The first edition was released during November/December 2024.
- Issue with mapping of disputed territories around the world: See our wiki-page on OSM - here.
Data License
OpenStreetMap is open data, licensed under the Open Data Commons Open Database License (ODbL). The full license text is available from http://www.openstreetmap.org/copyright. You are free to copy, distribute, transmit and adapt our data, as long as you credit OpenStreetMap and its contributors.
Credits
OpenStreetMap require that you use the credit “© OpenStreetMap contributors”. Please remember to add this text when using EMD Electrical Grid Map.