Aster Global Digital Elevation Model: Difference between revisions
| Line 14: | Line 14: | ||
As seen from the pictures here - where Aster GDEM and SRTM 90 m data are compared - then the Aster GDEM data is much more 'noisy', even if the ASTER data is made by a 30 m grid as opposed to the SRTM 90 m grid. Below you can see two DEM’s from a Danish site near Skive (about 75 km west from Aalborg). Contours are generated from the original raw grid files using WindPRO and a 5 m equidistance. | As seen from the pictures here - where Aster GDEM and SRTM 90 m data are compared - then the Aster GDEM data is much more 'noisy', even if the ASTER data is made by a 30 m grid as opposed to the SRTM 90 m grid. Below you can see two DEM’s from a Danish site near Skive (about 75 km west from Aalborg). Contours are generated from the original raw grid files using WindPRO and a 5 m equidistance. | ||
{ | |||
|- | |- | ||
| test | | test | ||
| Line 20: | Line 21: | ||
| | | | ||
|- | |- | ||
} | |||
== Download of ASTER GDEM data == | == Download of ASTER GDEM data == | ||
Revision as of 14:45, 23 May 2013

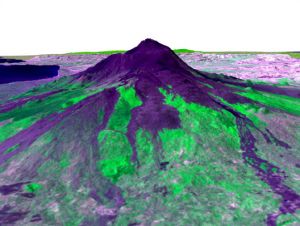
The Aster (Advanced Spaceborne Thermal Emission and Reflection Radiometer) Global Digital Elevation Model - or short just Aster GDEM - is a joint US and Japanese effort. It is based on data from sensors on board on the NASA Terra satellite launched in 1999. The first release of the Aster GDEM dataset was in June 2009.
Data Coverage
The Aster GDEM dataset has a 30 m resolution with a 99% global coverage. However, the current version of the dataset is marked as ‘research grade’, and is reported to contain serious artifacts and spikes.
Availability in WindPRO
Currently, the dataset is not included with WindPRO, primarily because the data license does not allow redistribution of the raw data. However, you may choose to manually download the source DEM’s yourself and then import it into WindPRO.
Data Evaluations
Unfortunately the dataset is not of a very good quality. Possibly, this seems to be not a data-processing problem but rather an inherent problem with the method. If this is the case, then we might not expect a ‘better’ release of the dataset. Typically the data is polluted with many artifacts, artificial spikes, rendering the highly questionable for wind energy purposes. A spike typically rises about 50-100 m from the general terrain.
As seen from the pictures here - where Aster GDEM and SRTM 90 m data are compared - then the Aster GDEM data is much more 'noisy', even if the ASTER data is made by a 30 m grid as opposed to the SRTM 90 m grid. Below you can see two DEM’s from a Danish site near Skive (about 75 km west from Aalborg). Contours are generated from the original raw grid files using WindPRO and a 5 m equidistance.
{ |- | test | test |- | |- }
Download of ASTER GDEM data
You may download the data from the Aster GDEM site at:
External Links
- More information on ASTER data is available from NASA / Jet Propulsion Laboratory at http://asterweb.jpl.nasa.gov/