Difference between revisions of "MODIS VCF"
| Line 1: | Line 1: | ||
[[Category:Online Data]][[Category:Digital Roughness Data]] | [[Category:Online Data]][[Category:Digital Roughness Data]] | ||
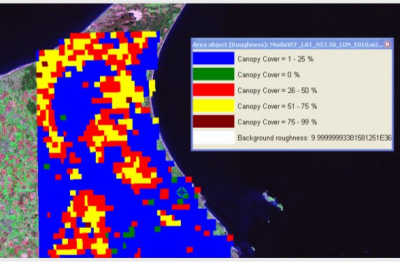
| − | [[File:ModisVCFPic.png|right| | + | [[File:ModisVCFPic.png|right|400px|thumb|Modis VCF Data for the North-Eastern Part of Jutland, Denmark.]] |
== Introduction == | == Introduction == | ||
The Modis VCF (Vegetation Continuous Fields) data holds a global 500 x 500 m resolution dataset on the vegetation cover. The dataset consists of three files: Percent trees, bare ground and herbaceous vegetation. The WindPRO online data service converts these three files into a roughness classification legend. The Modis VCF is an annual representation of the period November 2000 to November 2001. | The Modis VCF (Vegetation Continuous Fields) data holds a global 500 x 500 m resolution dataset on the vegetation cover. The dataset consists of three files: Percent trees, bare ground and herbaceous vegetation. The WindPRO online data service converts these three files into a roughness classification legend. The Modis VCF is an annual representation of the period November 2000 to November 2001. | ||
Revision as of 23:28, 23 May 2013
Introduction
The Modis VCF (Vegetation Continuous Fields) data holds a global 500 x 500 m resolution dataset on the vegetation cover. The dataset consists of three files: Percent trees, bare ground and herbaceous vegetation. The WindPRO online data service converts these three files into a roughness classification legend. The Modis VCF is an annual representation of the period November 2000 to November 2001.
Coverage
The coverage is near global. Only Antarctica and the polar region above 80 degrees north is missing. Please note that this roughness classification is based on a vegetation index only. Hence, urban areas must be added manually. In addition, the conversion from vegetation cover to roughness classification is still experimental only.
Data Processing at EMD
An overview is of the EMD legend is shown in the table below. This legend is created by using a simple algorithm for the conversion from canopy cover to roughness class. For now, this algorithm is a simple linear relationship – a function of the canopy cover only. At a later stage, this algorithm may be improved by adding dependencies on herbaceous vegetation and bare ground percentages.
TABLE HERE
In the case that you are using this dataset near oceans, please make sure that you manually convert the roughness classes for the water areas from roughness class 0.2 to 0.0, as the WAsP model then will use a more appropriate stability model.
The interpretation for WindPRO 2.7 and later releases is shown in the table. Please note that the interpretation has changed since the version 2.6; now slightly higher roughness classes are assumed for lower values of the canopy cover. However, based on even more recent experiences, the 76-100% canopy cover interval should probably be increased to class 3.5 – 4.0, with an additional increase for the lower intervals also. Please do consider such experiences when you use this dataset, and remember to apply a proper screening and calibration of the data for your particular purposes.
Acknowledgement
Raw data source for this dataset was the Global Land Cover Facility at http://www.landcover.org
