EMD-WRF On-Demand ICING: Difference between revisions
No edit summary |
No edit summary |
||
| (19 intermediate revisions by 3 users not shown) | |||
| Line 1: | Line 1: | ||
[[Category:Online Data]][[Category:Wind Data]] | [[Category:Online Data]][[Category:Wind Data]] | ||
[[File:IcingPicture.png|thumb|400px|right|Example of a cold-climate wind farm.]][[Image:MastWithSensor.png|thumb|right|400px|Heated cup anemometer at iced mast.]][[File: | [[File:IcingPicture.png|thumb|400px|right|Example of a cold-climate wind farm.]][[Image:MastWithSensor.png|thumb|right|400px|Heated cup anemometer at iced mast.]][[File:Iea loss nz site.png|thumb|400px|right|Icing Map in windPRO with IEA Loss Percentage AEP as Legend]] | ||
[[File:histograms.png|thumb|right|400px|Histograms during meteorological icing (example results from report).]][[File:seasonal.png|thumb|right|400px|Seasonal variation of modelled instrumental and meteorological icing (example results from report).]] | |||
== Introduction == | == Introduction == | ||
EMD-WRF OD ICING is the name of EMD’s icing model. It is available as a time-series product, similar to the well known [https://help.emd.dk/mediawiki/index.php?title=EMD-WRF_On-Demand_and_Custom-Area EMD-WRF OD service]. The model is fully validated: A technical note with results | EMD-WRF OD ICING is the name of EMD’s icing model; it was first released in September 2022 with the availability of windPRO 3.6. It is available as a time-series product, similar to the well known [https://help.emd.dk/mediawiki/index.php?title=EMD-WRF_On-Demand_and_Custom-Area EMD-WRF OD service]. The model is fully validated: A technical note with results from recent validation study on EMD-WRF OD ICING is available [14], see further below for the download link. | ||
The EMD-WRF OD ICING model is configured with the following setup: | The EMD-WRF OD ICING model is configured with the following setup: | ||
| Line 18: | Line 18: | ||
* The modelled icing results (IEA loss/class and meteorological icing hours) are downscaled to the terrain elevation height of the Copernicus DEM’s [15] for making icing maps. | * The modelled icing results (IEA loss/class and meteorological icing hours) are downscaled to the terrain elevation height of the Copernicus DEM’s [15] for making icing maps. | ||
The final step of EMD’s modelling chain, is an estimate of the expected production loss of a site which is found by using the IEA Ice Classification system seen in Table 1 below. A wide range of climate parameters will be | The final step of EMD’s modelling chain, is an estimate of the expected production loss of a site which is found by using the IEA Ice Classification system seen in Table 1 below. A wide range of climate parameters will be available from a model-run; the complete list of parameters are seen in the Table 2 further below. | ||
{| class="wikitable" style="text-align: center;" | {| class="wikitable" style="text-align: center;" | ||
| Line 54: | Line 54: | ||
== Usage Notes == | == Usage Notes == | ||
'''Interested in the performance of the EMD-WRF On-Demand ICING modelling chain and a validation study?<br> | * '''Interested in the performance of the EMD-WRF On-Demand ICING modelling chain and a validation study?'''<br>A validation paper by Petersen et al is available. It was presented at the International Workshop on Atmospheric Icing of Structures 2022:<br>''On the Modelling Chain for Production Loss Assessment for Wind Turbines in Cold Climates.'' The paper is available as a [https://help.emd.dk/mediawiki/images/b/b3/Pedersen_OnModellingChainForProductionLossAssessmentWindTurbinesInColdClimates_2022.pdf pdf-file] here. | ||
A validation paper by Petersen et al is | * '''Doing EMD-WRF OD ICING evaluations in very complex terrain/orography?'''<br>EMD-WRF OD ICING relies on a downscaling approach with coupled-modelling at both mesoscale (3km grid resolution) and microscale (30m grid resolution). However, when in complex terrain, these resolutions are not always fine enough to ensure sufficient modelling accuracy. If the differences between meso- and micro terrain elevations are large (some hundreds of meters), then caution is advised, and users should expect increased uncertainty in results. If you are an EMD-WRF OD ICING user, feel free to contact the modelling team through the windPRO support hotline for further guidance and recommendations (support@emd.dk). | ||
''On the Modelling Chain for Production Loss Assessment for Wind Turbines in Cold Climates.'' The paper is | |||
== What you get and how to order? == | == What you get and how to order? == | ||
To get pointwise-timeseries data, you need meso-credits ( | To get pointwise-timeseries data, you need meso-credits (two credits are worth one month of mesoscale icing data). Credits can be ordered here: http://www.emd.dk/windpro/online-ordering/ | ||
Please note, that a time period of 10 seasons will include the complete icing analysis, whereas shorter time periods include only raw timeseries. | Please note, that a time period of 10 seasons will include the complete icing analysis, whereas shorter time periods include only raw timeseries. | ||
| Line 71: | Line 70: | ||
* Monthly, yearly and seasonal icing analysis and bin-sector analysis as csv-files | * Monthly, yearly and seasonal icing analysis and bin-sector analysis as csv-files | ||
* Timeseries of raw WRF data and modelled icing | * Timeseries of raw WRF data and modelled icing | ||
'''windPRO 3.6 Sample File and Reports'''<br> | |||
If you are a windPRO 3.6 user and interested in seeing a sample icing-calculation with reports, data-sheets (excel) and downscaled maps, then we have the Stor Rotliden sample available for download: | |||
* windPRO 3.6 export file - [https://help.emd.dk/knowledgebase/content/Files/StorRotliden_Public_Icing_20221108.w36e here].<br>Just download, inspect the downscaled icing maps (result-layers) and find the icing pdf-reports within the meteo-object (see the .mesores tab). | |||
* pdf-sample report - 100m hub height - [https://help.emd.dk/mediawiki/images/0/02/EmdWrf_N64.222_E018.358_IcingReport.100.pdf here]. (More heights in the windPRO project file) | |||
* time series data - excel - 100m hub height -[https://help.emd.dk/mediawiki/images/7/7f/EmdWrf_N64.222_E018.358_IcingResults.100.xlsx here] (More heights in the windPRO project file) | |||
== Data Availability == | == Data Availability == | ||
| Line 83: | Line 88: | ||
|EMD-WRF OD (ERA5) | |EMD-WRF OD (ERA5) | ||
|1999.01.01 | |1999.01.01 | ||
| | |7-10 days from end of last month | ||
|} | |} | ||
== Set of Standard Dataset Parameters for EMD-WRF OD ICING == | == Set of Standard Dataset Parameters for EMD-WRF OD ICING == | ||
A large quantity of useful parameters are available directly in | A large quantity of useful parameters are available directly in windPRO to aid in your analysis. The different parameters in each On-Demand ICING dataset is shown in the list below.<br> | ||
Unless other specification, x is the vertical heights of: 10m, 25m, 50m, 75m, 100m, 150m, 200m, 300m, 400m, 500m, 600m, 1000m. | Unless other specification, x is the vertical heights of: 10m, 25m, 50m, 75m, 100m, 150m, 200m, 300m, 400m, 500m, 600m, 1000m. | ||
Latest revision as of 14:47, 30 June 2023
Introduction
EMD-WRF OD ICING is the name of EMD’s icing model; it was first released in September 2022 with the availability of windPRO 3.6. It is available as a time-series product, similar to the well known EMD-WRF OD service. The model is fully validated: A technical note with results from recent validation study on EMD-WRF OD ICING is available [14], see further below for the download link.
The EMD-WRF OD ICING model is configured with the following setup:
- Driven by an icing configuration of the standard EMD WRF [1] On-Demand service [2].
- Run with a spatial resolution of 3x3 km and an hourly temporal resolution.
- Using the ERA-5 reanalysis data from ECMWF as global boundary data [3], see Table 2 below.
- Microphysics from Thompson scheme is used for parameterization of the cloud physics and the MYJ scheme for the planetary boundary layer physics [4], [5].
- The median volume diameter (MVD) by [6] is used, with a constant droplet concentration (Nc) of (default) 100 cm-3 and the liquid water content (LWC) in kg/m3 [7].
- Atmospheric data feeds into the standard cylinder-based model [8], [9] including melting and shedding [10].
- The WRF grid point (latitude, longitude) closest to the at mast location or site location is used as a default.
- The grid point holds a certain elevation above sea level and icing is modelled as a default for 15 heights in the vertical direction above ground level (agl.).
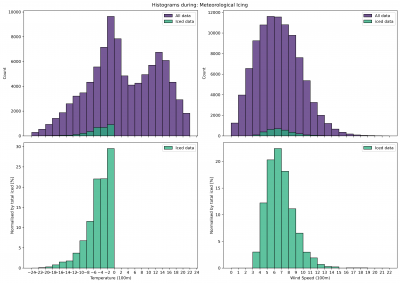
- The modelled ice load (kg) is used to identify hours of instrumental icing based on the industry standard thresholds of 10 g [11]. And similar from the modelled ice accretion rate (g/h), hours of meteorological icing [12] is found using the threshold of 10 g/h [9].
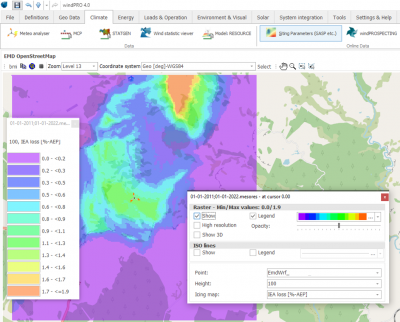
- The modelled icing results (IEA loss/class and meteorological icing hours) are downscaled to the terrain elevation height of the Copernicus DEM’s [15] for making icing maps.
The final step of EMD’s modelling chain, is an estimate of the expected production loss of a site which is found by using the IEA Ice Classification system seen in Table 1 below. A wide range of climate parameters will be available from a model-run; the complete list of parameters are seen in the Table 2 further below.
| IEA Ice-Class |
Meteorological Icing (% of year) |
Instrumental Icing (% of year) |
Production loss (% of AEP) |
|---|---|---|---|
| 5 | > 10.0 | > 20.0 | > 20.0 |
| 4 | 5.0 - 10.0 | 10.0 - 30.0 | 10.0 - 25.0 |
| 3 | 3.0 - 5.0 | 6.0 - 15.0 | 3.0 - 12.0 |
| 2 | 0.5 - 3.0 | 1.0 - 9.0 | 0.5 - 5.0 |
| 1 | 0.0 - 0.5 | < 1.5 | 0.0 - 0.5 |
Usage Notes
- Interested in the performance of the EMD-WRF On-Demand ICING modelling chain and a validation study?
A validation paper by Petersen et al is available. It was presented at the International Workshop on Atmospheric Icing of Structures 2022:
On the Modelling Chain for Production Loss Assessment for Wind Turbines in Cold Climates. The paper is available as a pdf-file here. - Doing EMD-WRF OD ICING evaluations in very complex terrain/orography?
EMD-WRF OD ICING relies on a downscaling approach with coupled-modelling at both mesoscale (3km grid resolution) and microscale (30m grid resolution). However, when in complex terrain, these resolutions are not always fine enough to ensure sufficient modelling accuracy. If the differences between meso- and micro terrain elevations are large (some hundreds of meters), then caution is advised, and users should expect increased uncertainty in results. If you are an EMD-WRF OD ICING user, feel free to contact the modelling team through the windPRO support hotline for further guidance and recommendations (support@emd.dk).
What you get and how to order?
To get pointwise-timeseries data, you need meso-credits (two credits are worth one month of mesoscale icing data). Credits can be ordered here: http://www.emd.dk/windpro/online-ordering/
Please note, that a time period of 10 seasons will include the complete icing analysis, whereas shorter time periods include only raw timeseries. Complete icing analysis includes:
- Icing reports as pdfs at three hub-heights - 100m, 150m and 200m
- Including predicted AEP loss
- Icing maps at three hub-heights - 100m, 150m and 200m
- IEA ice class, IEA Ice loss (% AEP) and modelled meteorological icing (icing rate > 10 g/h)
- The possibility to use your icing results and timeseries directly in your windPRO project
- Monthly, yearly and seasonal icing analysis and bin-sector analysis as csv-files
- Timeseries of raw WRF data and modelled icing
windPRO 3.6 Sample File and Reports
If you are a windPRO 3.6 user and interested in seeing a sample icing-calculation with reports, data-sheets (excel) and downscaled maps, then we have the Stor Rotliden sample available for download:
- windPRO 3.6 export file - here.
Just download, inspect the downscaled icing maps (result-layers) and find the icing pdf-reports within the meteo-object (see the .mesores tab). - pdf-sample report - 100m hub height - here. (More heights in the windPRO project file)
- time series data - excel - 100m hub height -here (More heights in the windPRO project file)
Data Availability
All EMD-WRF OD ICING is available with global spatial coverage. The temporal availability and update frequency depends on a number of factors such as availability from the boundary data providers, bandwidth and download times, as well as availability on EMD high-performance computing and storage systems. EMD-WRF OD ICING is availability with the ERA5 only, see table below.
| Dataset | First date | Most recent date |
|---|---|---|
| EMD-WRF OD (ERA5) | 1999.01.01 | 7-10 days from end of last month |
Set of Standard Dataset Parameters for EMD-WRF OD ICING
A large quantity of useful parameters are available directly in windPRO to aid in your analysis. The different parameters in each On-Demand ICING dataset is shown in the list below.
Unless other specification, x is the vertical heights of: 10m, 25m, 50m, 75m, 100m, 150m, 200m, 300m, 400m, 500m, 600m, 1000m.
| Parameter | Unit | Description | Type |
|---|---|---|---|
| time | UTC time stamp | ||
| psfc | Pa | Pressure at site | Instantaneous |
| msl | Pa | Pressure at mean sea level | Instantaneous |
| wSpeed.x | m/s | Wind speeds | Instantaneous |
| wDir.x | deg | Wind direction | Instantaneous |
| wSpeed.0-30mb | m/s | Wind speeds at pressure level 0-30mb. | Instantaneous |
| wDir.0-30mb | deg | Wind speeds at pressure levels 0-30mb. | Instantaneous |
| wSpeed.850hpa | m/s | Wind speeds at pressure level 850hPa. | Instantaneous |
| wDir.850hpa | deg | Wind speeds at pressure levels 850hPa. | Instantaneous |
| temperature.2 | celcius | Temperatures at height 2m | Instantaneous |
| waterTemp | celcius | Water temperature | Instantaneous |
| soilTemp.0-10cm | celcius | The temperature in the upper 10cm of the soil | Instantaneous |
| relHumidity.2 | % | Relative humidity in height 2m above ground level | Instantaneous |
| snowDepth | m | Snow depth (if present) | Instantaneous |
| vis.s | m | Visibility at surface | Instantaneous |
| sensHeatFlux.s | w/m2 | Sensible Heat Flux at surface | Instantaneous |
| totPrecip.s | kg/m^2 | Total Precipitation at surface | 1h Accumulated |
| downShortWaveFlux.s | w/m^2 | Downward shortwave irradiance at surface | 1h Average |
| totalCloudCover.a | % | Total cloud cover in atmosphere | 1h Average |
| convCloudCover.a | % | Convective cloud cover in atmosphere | 1h Average |
| 4LFTX | K | N/A | |
| rmol | 1/m | Inverse Monin-Obukhov-Length | |
| znt | m | Rougnhess length | Instantaneous |
| u* | m/s | U-star (friction velocity) | Instantaneous |
| swdDir.s | W/m^2 | Direct shortwave irradiance at surface | 1h Average |
| swdDni.s | W/m^2 | Direct normal shortwave irradiance at surface | 1h Average |
| swdDif.s | W/m^2 | Diffusive shortwave irradiance at surface | 1h Average |
| sqrtTKE.x | m/s | Wind speed given as standard deviation in m/s. Derived from the turbulent kinetic energy (TKE) | Instantaneous |
| cloudWater.x | mg/kg | Cloud water content | Instantaneous |
| cloudIce.x | mg/kg | Cloud ice content | Instantaneous |
| press.x | Pa | Pressure | Instantaneous |
| temperature.x | celcius | Temperatures | Instantaneous |
| rh.x | % | Relative humidity | Instantaneous |
| vis.x | m | Visibility | Instantaneous |
| cloudBottom | m | Distance from ground level to the bottom of cloud | Instantaneous |
| cloudTop | m | Distance from ground level to the top of cloud | Instantaneous |
| waterTemp | celcius | Water temperature | Instantaneous |
| Ice model output parameters. | |||
| iceInten.x | g/h | Ice accretion rate (intensity) [8][9] | Instantaneous |
| MIce.x | kg | Ice load on a standard cylinder [13] | Instantaneous |
| MeteoSignal.x | Meteorological icing, iceInten.x > 10g/h [9] | Instantaneous | |
| InstruSignal.x | Instrumental Icing, MIce.x > 10g [11] | Instantaneous | |
| MVD.x | m | Median Volume Diameter [6] | Instantaneous |
| LWC.x | kg/m^3 | Liquid Water Content [10] | Instantaneous |
References
- W. C. Skamarock, J. B. Klemp, J. G. D. O. Dudhia, D. M. Barker, W. Wang and J. G. Powers, “A description of the advanced research WRF version 2,” NCAR Technical Note, Boulder, Colorado, USA, 20005.
- M. L. Thøgersen, “help.emd.dk,” EMD International A/S, 2019. [Online]. Available: https://help.emd.dk/mediawiki/index.php?title=EMD-WRF_On-Demand_and_Custom-Area. [Accessed 30 November 2021].
- ECMWF, “Advancing global NWP through international collaboration,” ECMWF, [Online]. Available: https://www.ecmwf.int/. [Accessed 23 March 2022].
- G. Thompson, P. R. Field, R. M. Rasmussen and W. D. Hall, “Explicit Forecasts of Winter Precipitation Using an Improved Bulk Microphysics Scheme. Part II: Implementation of a New Snow Parameterization,” American Meteorological Society, vol. 136, no. Monthly Weather review, pp. 5095-5115, 2008.
- Z. I. Janjic, “Nonsingular Implementation of the Mellor-Yamada Level 2.5 Scheme in the NCEP Meso model,” National Centers for Environmental Prediction, Washington, 2001.
- K. Finstad, E. Lozowski and L. Makkonen, “On the median volume diameter approximation for droplet collision efficiency,” Journal of Atmospheric Sciences, vol. 45, pp. 4008-4012, 1988.
- G. Thompson, B. E. Nygaard, L. Makkonen and S. Dierer, “Using the Weather Research and Forecasting (WRF) model to predict ground/structural icing,” in International Workshop on Atmospheric Icing on Structures (IWAIS), 2009.
- L. Makkonen, "Models for the Growth of Rime Glaze Icicles and Wet Snow on Structures," Royal Society, vol. 1776, no. Ice and Snow Accretion on Structures, pp. 2913 - 2939, 2000.
- ISO, "DS/ISO 12494:2017 Atmospheric icing on structures," Danish Standard Association, København, 2017.
- K. Harstveit, “Using Metar-data to Calculate In-cloud Icing on a Mountain Site Near by the airport,” in 13th International Workshop on Atmospheric Icing on Structures (IWAIS), Andermat, Switzerland, 2009.
- K. Hämäläinen and S. Niemelä, “Production of a Numerical Icing Atlas for Finland,” Wind Energy, vol. 20, pp. 171-189, 2017.
- I. Baring-Gould, R. Cattin, M. Durstewitz, M. Hulkkonen, A. Krenn, T. Laakso, A. Lacroix, E. Peltola, G. Ronsten, L. Tallhaug and T. Wallenius, "13 Wind Energy Projects in Cold Climate 1st edition," IEA Wind Task 19, 2011.
- L. Makkonen, "Modelling of Ice Accretion on Wires," Climate Appl. Meteor., vol. 23, pp. 929-939, 1984.
- M.C. Pedersen, T. Ahsbahs, W. Langreder, M.L. Thøgersen: On the Modelling Chain for Production Loss Assessment for Wind Turbines in Cold Climates, Proceedings – Int. Workshop on Atmospheric Icing of Structures, IWAIS 2022 - Montreal, Canada, June 19-23 (pdf-here)
- M. L. Thøgersen, “help.emd.dk,” EMD International A/S, 2021. [Online]. Available: https://help.emd.dk/mediawiki/index.php?title=Copernicus_DEM. [Accessed 09 August 2022].