QuikScat: Difference between revisions
(Created page with "QuikScat is an offshore wind dataset based on remote sensing from a satellite instrument. The QuikScat wind data are derived from a remote sensing microwave scatterometer tha...") |
|||
| (20 intermediate revisions by 2 users not shown) | |||
| Line 1: | Line 1: | ||
[[Category:Online Data]][[Category:Wind Data]] | |||
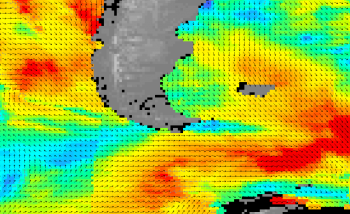
[[File:QuikScatAtCapeHorn.png|right|thumb|350px|QuikScat Map of Wind Speeds and Direction in the Cape Horn Region.]] | |||
QuikScat is an offshore wind dataset based on remote sensing from a satellite instrument. | QuikScat is an offshore wind dataset based on remote sensing from a satellite instrument. | ||
== Discontinued Dataset! == | |||
The rotating antenna on the QuikScat satellite malfunctioned at the end of November 2009. While the satellite was designed with an expected lifetime of 5 years, it was actually in operation in 10 years. Currently, there are no plans for a replacement satellite. A new dedicated offshore wind dataset is available though, through the [[Blended_Coastal_Winds|Blended Coastal Winds]]. | |||
== Quikscat Data == | |||
The QuikScat wind data are derived from a remote sensing microwave scatterometer that is mounted on the QuikScat satellite; the satellite was launched in June 1999. The scatterometer is a special type of radar that is used to analyze the roughness of the sea. This fine scale roughness is highly correlated to near-surface winds and directions – and as such it is possible to infer the wind conditions based on the scatterometer data. | The QuikScat wind data are derived from a remote sensing microwave scatterometer that is mounted on the QuikScat satellite; the satellite was launched in June 1999. The scatterometer is a special type of radar that is used to analyze the roughness of the sea. This fine scale roughness is highly correlated to near-surface winds and directions – and as such it is possible to infer the wind conditions based on the scatterometer data. | ||
The QuikScat dataset at EMD currently holds 10 meter wind speed derived from the fine scale surface roughness of the sea surface. According to the documentation on the QuikScat data, the wind corresponds to an 8-10 minute averaged wind speed | The QuikScat dataset at EMD currently holds 10 meter wind speed derived from the fine scale surface roughness of the sea surface. According to the [http://www.ssmi.com/qscat/ documentation on the QuikScat data], the wind corresponds to an 8-10 minute averaged wind speed.. The temporal coverage is at maximum 2 times a day, but with a number of gaps with data missing due to problems, such as the instrument being turned off. | ||
== Spatial Coverage == | |||
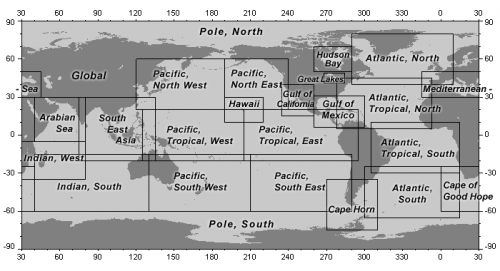
The spatial coverage is near global for sea areas with a resolution of 0.25 degrees. The spatial coverage is shown in figure below. | |||
[[File:CoverageQuikScat.png|center|thumb|500px|Spatial Coverage of the QuikScat Dataset]] | |||
== Data Accuracy == | |||
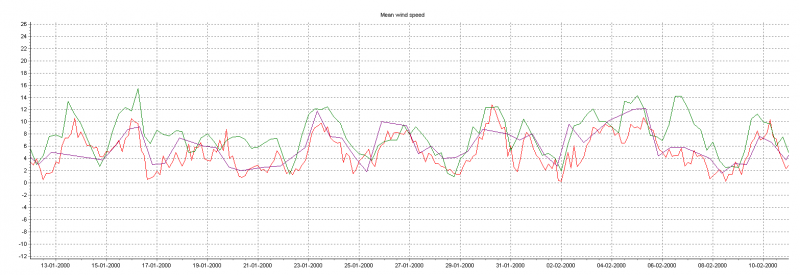
The accuracy of this method is decreased during rain events or during sea-ice events. When receiving the data from WindPRO, then all data are enabled by default. If you do not want do use the wind data that occur during rain events, then you will have to manually disable those data. The data files received from WindPRO hold an extra column named ‘rain_flag’; this column is easily applied for this purpose (but it is a manual operation!). An example of the QuikScat data is shown in the figure below. | |||
[[File:QuikScat.png|thumb|center|800px|QuikScat data (purple), NARR data (red) and NCEP/NCAR Reanalysis Data (green) on an offshore position of the coast of San Francisco, USA.]] | |||
== QuikScat Dataset Overview Table == | |||
<center> | |||
{| class="wikitable" | |||
|+ align="bottom"|Table: Overview of QuikScat Dataset Features. | |||
!Name | |||
!Description | |||
|- | |||
|Abbreviation | |||
|u10 = 8-10 minute averaged wind speeds | |||
|- | |||
|External URL | |||
|http://www.ssmi.com/qscat/ | |||
|- | |||
|Data valid at time | |||
|Data valid at the reference time | |||
|- | |||
|Level | |||
|10 m above ground | |||
|- | |||
|Grid | |||
|0.25 degree latitude – longitude grid | |||
|- | |||
|Coverage | |||
|Near global coverage for sea areas | |||
|- | |||
|Columns in data-file | |||
|wsp.10= Wind Speed at 10 m a.g.l<br>dir.10 = Wind Direction at 10 m a.g.l | |||
|- | |||
|Time stamps in data-file | |||
|Separate columns for year (YYYY), month (M), day (D) and time (HH:MM). Time is UTC. | |||
|} | |||
</center> | |||
== External Links == | == External Links == | ||
Homepage for the QuikScat data: [http://www.ssmi.com/qscat/ http://www.ssmi.com/qscat/]. | Homepage for the QuikScat data: [http://www.ssmi.com/qscat/ http://www.ssmi.com/qscat/]. | ||
Latest revision as of 11:28, 15 April 2021

QuikScat is an offshore wind dataset based on remote sensing from a satellite instrument.
Discontinued Dataset!
The rotating antenna on the QuikScat satellite malfunctioned at the end of November 2009. While the satellite was designed with an expected lifetime of 5 years, it was actually in operation in 10 years. Currently, there are no plans for a replacement satellite. A new dedicated offshore wind dataset is available though, through the Blended Coastal Winds.
Quikscat Data
The QuikScat wind data are derived from a remote sensing microwave scatterometer that is mounted on the QuikScat satellite; the satellite was launched in June 1999. The scatterometer is a special type of radar that is used to analyze the roughness of the sea. This fine scale roughness is highly correlated to near-surface winds and directions – and as such it is possible to infer the wind conditions based on the scatterometer data.
The QuikScat dataset at EMD currently holds 10 meter wind speed derived from the fine scale surface roughness of the sea surface. According to the documentation on the QuikScat data, the wind corresponds to an 8-10 minute averaged wind speed.. The temporal coverage is at maximum 2 times a day, but with a number of gaps with data missing due to problems, such as the instrument being turned off.
Spatial Coverage
The spatial coverage is near global for sea areas with a resolution of 0.25 degrees. The spatial coverage is shown in figure below.

Data Accuracy
The accuracy of this method is decreased during rain events or during sea-ice events. When receiving the data from WindPRO, then all data are enabled by default. If you do not want do use the wind data that occur during rain events, then you will have to manually disable those data. The data files received from WindPRO hold an extra column named ‘rain_flag’; this column is easily applied for this purpose (but it is a manual operation!). An example of the QuikScat data is shown in the figure below.

QuikScat Dataset Overview Table
| Name | Description |
|---|---|
| Abbreviation | u10 = 8-10 minute averaged wind speeds |
| External URL | http://www.ssmi.com/qscat/ |
| Data valid at time | Data valid at the reference time |
| Level | 10 m above ground |
| Grid | 0.25 degree latitude – longitude grid |
| Coverage | Near global coverage for sea areas |
| Columns in data-file | wsp.10= Wind Speed at 10 m a.g.l dir.10 = Wind Direction at 10 m a.g.l |
| Time stamps in data-file | Separate columns for year (YYYY), month (M), day (D) and time (HH:MM). Time is UTC. |
External Links
Homepage for the QuikScat data: http://www.ssmi.com/qscat/.