CFS- and CFSR Data: Difference between revisions
No edit summary |
|||
| Line 15: | Line 15: | ||
== The Model == | == The Model == | ||
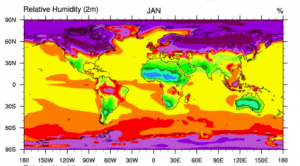
[[File:CFSR_RelativeHumidity.png|right|thumb| | [[File:CFSR_RelativeHumidity.png|right|thumb|300px|<center>Example of CFSR data (Credit: NOAA)</center>]] | ||
The CFSR global atmosphere resolution is ~38 km (T382) with 64 levels. The global ocean is 0.25° at the equator, extending to a global 0.5° beyond the tropics, with 40 levels. The global land surface model has 4 soil levels and the global sea ice model has 3 levels. The CFSR atmospheric model contains observed variations in carbon dioxide (CO2), together with changes in aerosols and other trace gases and solar variations. With these variable parameters, the analyzed state will include estimates of changes in the Earth system climate due to these factors. | The CFSR global atmosphere resolution is ~38 km (T382) with 64 levels. The global ocean is 0.25° at the equator, extending to a global 0.5° beyond the tropics, with 40 levels. The global land surface model has 4 soil levels and the global sea ice model has 3 levels. The CFSR atmospheric model contains observed variations in carbon dioxide (CO2), together with changes in aerosols and other trace gases and solar variations. With these variable parameters, the analyzed state will include estimates of changes in the Earth system climate due to these factors. | ||
Revision as of 15:40, 26 May 2013

The CFSR is a third generation reanalysis product. It is a global, high resolution, coupled atmosphere-ocean-land surface-sea ice system designed to provide the best estimate of the state of these coupled domains over this period. The CFSR includes (1) coupling of atmosphere and ocean during the generation of the 6 hour guess field, (2) an interactive sea-ice model, and (3) assimilation of satellite radiances.
Model Resolution and Coverage
EMD holds a subset of the CFSR data in different spatial resolutions.
- 0.5 degree resolution (CFSR-Merged, period 1979-present)
- 0.3 degree resolution (CFSR v.1, period 1979-2010)
- 0.2 degree resolution (CFSR v.2, period 2011-present)
All have a global coverage over land masses and is extended about 50 km into the sea near coastlines. The temporal resolution is 1 hour. Currently only the 0.5 degree data is available from within WindPRO.
The Model

The CFSR global atmosphere resolution is ~38 km (T382) with 64 levels. The global ocean is 0.25° at the equator, extending to a global 0.5° beyond the tropics, with 40 levels. The global land surface model has 4 soil levels and the global sea ice model has 3 levels. The CFSR atmospheric model contains observed variations in carbon dioxide (CO2), together with changes in aerosols and other trace gases and solar variations. With these variable parameters, the analyzed state will include estimates of changes in the Earth system climate due to these factors.
More information available at: https://climatedataguide.ucar.edu/reanalysis/climate-forecast-system-reanalysis-cfsr
Data Availability
MERRA data is commonly available within WindPRO with a time-tag of 1-2 months. This is due to the processing time of the data at NASA and the subset-processing at EMD. When the data has been processed at EMD, then the following parameters are available from within the online-dataservices WindPRO. Please note that the displacement height is the height at which the log wind profile projects the wind to be zero. See more at the MERRA-FAQ.
| Parameter | Description |
|---|---|
| time | UTC time stamp |
| pressure | Sea level pressure |
| temperature | Temperature at 2 m above the displacement height |
| wDir | Wind direction at 50 m above surface |
| wSpeed | Wind speed at 50 m above surface |
| dispHeight | Displacement height |
Data Experiences
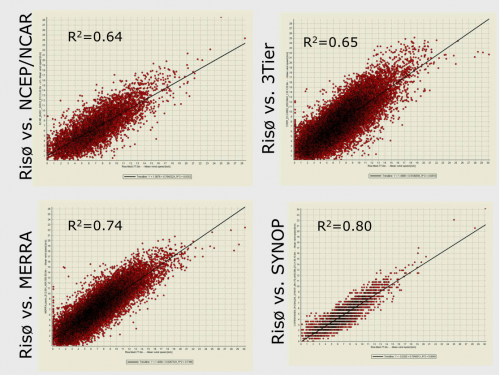
Generally, the MERRA data is always considered when seeking for candidate reference wind datasets for a particular site. Correlation between local measurements and MERRA data is often high, see the figure below. For his particular study made in 2010, MERRA data was compared against NCEP/NCAR, 3Tier (commercial data) and SYNOP data.

External Links
- The full CFSR data-set is available at UCAR http://rda.ucar.edu/pub/cfsr.html
- CFSR model description at NOAA: http://cfs.ncep.noaa.gov/cfsr/
- BAMS Paper on CFSR model by S. Shaha et al: The NCEP Climate Forecast System Reanalysis: http://journals.ametsoc.org/doi/pdf/10.1175/2010BAMS3001.1
Acknowledgement
Credits: The Global Modeling and Assimilation Office (GMAO) for the MERRA-analysis and the GES DISC for the dissemination of MERRA.