NCEP / NCAR Global Reanalysis Data

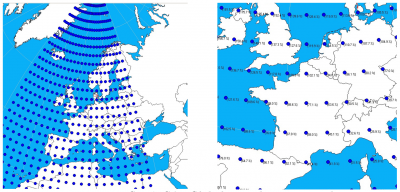
Left = Nodes Covering Western Europe. Right = Nodes Covering France.
Data from the NCEP/NCAR reanalysis project - in its edition 1 - is currently available to users of WindPRO as part of the on-line services from the EMD server. A connection to the internet is thus required. Users may download updated data from the present moment (typically the preceding month) back until 1948.
The sub-set of the NCEP/NCAR Global Reanalysis Data that we hold at EMD is updated on a monthly to bi-monthly update cycle.
Data Description
The NCEP/NCAR model dataset is immense, containing a very wide range of descriptive atmospheric model data. The actual measured climate data sources used in the global reanalysis model are:
- Upper air rawinsonde observations of temperature, horizontal wind, and specific humidity (i.e. weather balloons)
- Operational Television Infrared Observation Satellite (TIROS) Operational Vertical Sounder (TOVS) vertical temperature soundings from NOAA polar orbiters over ocean, with microwave retrievals excluded between 20°N and 20°S due to rain contamination
- TOVS temperature soundings over land only above 100 hPa
- Cloud-tracked winds from geostationary satellites
- Aircraft observations of wind and temperature
- Land surface reports of surface pressure
- Oceanic reports of surface pressure, temperature, horizontal wind, and specific humidity
These data are used as input into a frozen global assimilation system and processed by a spectral model in order to provide the model output of the variables in the grid.
NCEP/NCAR Global Reanalysis Dataset at EMD
Currently, two types of NCEP/NCAR modeled wind data are available from the EMD server. Both types of data are distributed through the NCAR_Basic dataset from the EMD server. The raw data are processed by EMD as the original data holds the vector components for the wind speeds only (U and V – winds). We convert the raw data into a format appropriate for use with wind turbine applications, i.e. wind speed and direction instead.
| Name | Description |
|---|---|
| Abbreviation | srf |
| External URL | http://www.cdc.noaa.gov/cdc/data.ncep.reanalysis.surface.html |
| Data valid at time | Instantaneous values at the reference time |
| Referred to as | “Wind" at level "sig995" under main title "Surface" |
| Level | 99.5% of surface pressure (approximately 42m a.g.l. for standard atmosphere conditions) |
| Grid | 2.5 degree latitude x 2.5 degree longitude global grid (144x73) |
| Coverage | Global |
| Columns in data-file | srf.dir.2 = Wind Direction at sigma level 0.995, i.e. 42 m a.g.l srf.wsp.2 = Wind Speed at sigma level 0.995, i.e. 42 m a.g.l gl.tmp.2 = Temperature at sigma level 0.995, i.e. at 42 m a.g.l |
| Name | Description |
|---|---|
| Abbreviation | u10 |
| External URL | http://www.cdc.noaa.gov/cdc/data.ncep.reanalysis.surfaceflux.html |
| Data valid at time | Forecasts valid 6 hours after the reference time |
| Referred to as | "Wind at 10m" at level: "surface" under main title "Surface Fluxes" |
| Level | 10 m above ground |
| Grid | T62 Gaussian grid with 192x94 points |
| Coverage | Global |
| Columns in data-file | u10.dir.10 = Forecast of Wind Direction at 10 m a.g.l u10.wsp.10 = Forecast of Wind Direction at 10 m a.g.l |
You may learn more about these data by visiting the NCEP / NCAR web site holding the data at the URL http://www.cdc.noaa.gov or by reading the paper Kistler et al. (2001) published in Bulletin of the American Meteorological Society. The paper is available for free at: http://www.atmos.umd.edu/~ekalnay/Kistleretal.pdf).
Although the NCEP/NCAR data are simulations giving the “instantaneous values” every 6 hours, these are based on model simulation and there will be some “smoothing” compared to real measurements. We therefore recommend seeing the data as 10 min average values, although this is not specified as so in the documentation.
Parameters
The following parameters are available from this dataset (see also description above).
| Parameter | Description |
|---|---|
| year | Year (YYYY) |
| month | Month (M) |
| day | Day (D) |
| hour | Hour (H) - in 6 hour steps (e.g. 0, 6, 12, 18) |
| min | Minute (M) |
| srf.dir.2 | Wind direction at surface (degrees) |
| srf.wsp.2 | Wind speed at surface (m/s) |
| u10.dir.10 | Wind direction at 10m height (degrees) |
| u10.wsp.10 | Wind speed at 10m height (m/s) |
| gl.tmp.2 | Ground level temperature (deg C) |
Converting Sigma Levels Coordinates into Physical Heights
Many of the NCEP / NCAR datasets are actually (internally) reported using sigma level coordinates. By definition, the sigma coordinate is the pressure at the current vertical level divided by the surface pressure level:
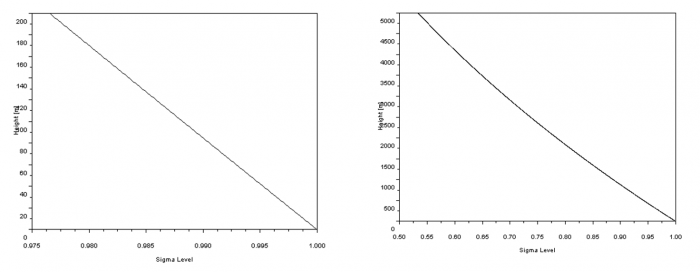
Using the definition above, as well as the US standard atmosphere model - see the WindPRO manual on Air Density Adjustments - it is possible to relate the sigma level coordinate to the physical height (by the assumption of the standard atmosphere parameters). This is shown in the figures below. The 0.995 sigma level coordinate is used in many of the ‘surface’ NCEP/NCAR datasets. This coordinate corresponds to a physical height equal to 42.2 m.

Some EMD Experience on Using the NCEP/NCAR Reanalysis Data
For long-term correction of local measurements, the 10m forecast data or the surface data give the best correlation. An additional upper air pressure level data set also exists, but has not been distributed via the EMD server. Our experience shows that the pressure level data does not seem to be quite as useful for long-term correction purposes, but might be usable as input for meso-scale models.
Data seem best applicable in colder climates, where the wind systems mainly are pressure-driven at the synoptic scale. In warmer regions (southern Europe and further south), the data do not seem to adequately account for the temperature-driven wind systems, and can therefore differ significantly from local measurements. Reasonable correlations can still be found for some regions and by scaling properly, the data might also be useful in these regions.
We recommend using the wind index method when performing long term correction with NCAR data – the frequency and direction distribution are often not good enough to allow the use of the other MCP methods.
Be aware of that the energy level based on only 1 year local data can be as much as 10% off – this is what numerous analyses, mainly in Northern Europe show. Having 3 years of local data the energy level probably will be up to 5% off.
Also be aware that the source for the NCEP/NCAR data is changing over time, so the older part of the data might be quite poor quality. Therefore we do normally not recommend to use data older than 1960 – and often you might not go further back than 1978. Brower (2006) ([1])suggested only using ten years of reanalysis data.
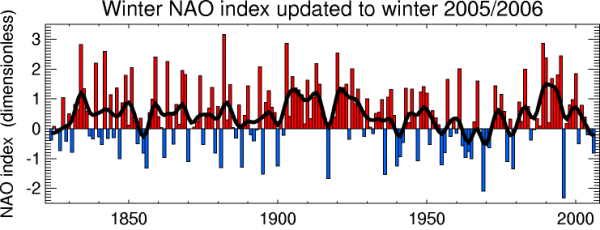
For Northern Europe, where the wind climate is heavily affected by the North Atlantic Oscillation (NAO Index, see Tim Osborn), you should go back to around 1961 to get a reasonable representative long term data period, holding both low- and high-wind climate periods, see figure. Using 1985-2005 may provide too high a long-term reference level – if history repeats itself, but nobody knows how the wind will be in the next 20 years!

A Note About NCEP/NCAR Reanalysis Node Positions in WindPRO
As the default behavior when online wind data is loaded into the WindPRO meteo object, the object will automatically be moved to the position of the data referring to the (in case of the NCEP/NCAR data the position of the 2.5 by 2.5 degrees data node). This means that in principle the “10m” data in the meteo is shown at a slightly wrong position – as these data are given on a Gaussian grid - which is also indicated in the header of the data file downloaded from the EMD on-line server. However, firstly this position error for the “10m” data should be small as the two grids are not very different and secondly EMD does not recommend the use of NCEP/NCAR for any purposes where the exact position is critical.
The main purpose of NCEP/NCAR global reanalysis data is still long-term correction, where the position of the grid point only plays a role for selecting the relevant model data. The position of the grid nodes for the data used are given in the file header provided by the EMD server. The time stamps for the 10 m data – which is actually forecast values of wind speeds and directions – are automatically adjusted in the Meteo Object so they match actual time of the forecast, i.e. the values refer to the time of the forecast (original time stamp is added 6 hours).
References
- Brower, M.C.: The Use of NCEP/NCAR Reanalysis Data in MCP, Proceedings of European Wind Energy Conference, Athens, 27 February - 2 March 2006
