NCEP North American Regional Reanalysis Data

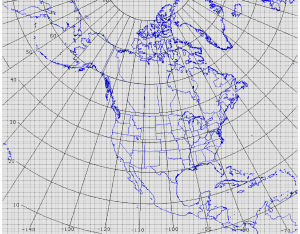
The NCEP North American Regional Reanalysis Data is a high resolution high frequency assimilated dataset covering the North American region. The model area is shown in the figure to the right.
Resolution
The spatial resolution is 32.4 km, resulting in a total of 96673 nodes covering the area. The temporal resolution is 3 hours. The dataset covers a period from 1979 until the present moment. The dataset assimilates data from rawinsondes, dropsondes, pibals, aircraft, selected surface stations and geostationary satellites.
The full dataset consists of more than 400 climate variables which – when stored in NetCDF files – require storage of about 30 Terra Bytes. At EMD we hold and distribute a subset of the NARR data. The raw data is processed by EMD as the original data holds the vector components for the wind speeds only (U and V – winds). We convert the raw data into a format appropriate for use with wind turbine applications, i.e. wind speed and direction instead.
NARR Dataset at EMD
The NARR dataset at EMD currently holds 10 m and 30 m wind speeds as well as 2 m temperature data. An overview of the data is given in the tables below. Please refer to these tables when interpreting the headers in the files received from the EMD server.
| Name | Description |
|---|---|
| Abbreviation | u10 = 10 minute averaged wind speeds |
| External URL | http://www.emc.ncep.noaa.gov/mmb/rreanl/ |
| Data valid at time | Data valid at the analysis/reference time |
| Referred to as | "Wind” at level: "10 m above ground level” or “30 m above ground level” |
| Level | 10 m above ground |
| Grid | Regional - NOAMHI - High Resolution North American Master Grid. Lambert Conformal with 349 x 277 nodes. |
| Coverage | North America |
| Columns in data-file | u10.dir.10 = Wind Direction at 10 m a.g.l u10.wsp.10 = Wind Direction at 10 m a.g.l u10.dir.30 = Wind Direction at 30 m a.g.l u10.wsp.30 = Wind Direction at 30 m a.g.l |
| Name | Description |
|---|---|
| Abbreviation | tmp = temperature |
| External URL | http://www.emc.ncep.noaa.gov/mmb/rreanl/ |
| Data valid at time | Data valid at the analysis/reference time |
| Referred to as | "temperature” at level: "surface" under main title "Surface Fluxes" |
| Grid | Regional - NOAMHI - High Resolution North American Master Grid. Lambert Conformal with 349 x 277 nodes. |
| Coverage | North America |
| Columns in data-file | tmp.2 = Temperature at 2 m a.g.l. (in degrees Celsius) |
Parameters
The following parameters are available from this dataset (see also description above).
| Parameter | Description |
|---|---|
| year | Year (YYYY) |
| month | Month (M) |
| day | Day (D) |
| hour | Hour (H) - in 3 hour steps (e.g. 0, 3, ... 21) |
| u10.dir.10 | Wind direction at 10m height (degrees) |
| u10.wsp.10 | Wind speed at 10m height (m/s) |
| u10.dir.30 | Wind direction at 30m height (degrees) |
| u10.wsp.30 | Wind speed at 30m height (m/s) |
| tmp.2 | Temperature at ground level (2m height) (deg C) |
NARR Sample Data at Fargo, ND
In the figure below, data from the NARR dataset is compared with local data from a 30 m sensor mounted on a local mast in Fargo, ND. Also shown is the NCEP/NCAR Reanalysis Data with its 6 hour temporal resolution.
The NARR node is located about 16 km from the local mast; while the NCAR Reanalysis node is located approximately 90 km from the site. It seems obvious, that the NARR is an improvement relative to the NCAR Reanalysis data – due to its increased accuracy and improved temporal and spatial resolution. An MCP analysis shows that the ‘Weighted mean of sector-wise correlation’ is about 0.75 for the NARR dataset versus the local data; while the value is 0.68 for the NCAR Reanalysis data versus the local data.

Known Issues

Credit: Justin Sharp, Iberdrola Renewables.
- The NCEP NARR internet homepage Regional Reanalysis Questions and Answers has reported an issue when using the 30 m wind data around coastlines. The issue occurs at coastlines with a non-negligible topography. Currently we recommend using the 10 m data at such places. Note that points over land are not affected (if the neighboring nodes have topography above the sea level). Please refer to reference for detailed information about this issue. When considering nodes ‘close’ to the boundaries of the model, then the variables will be heavily affected by the boundary conditions. Please validate the NARR data thoroughly against local measurements when you are near the model boundaries.
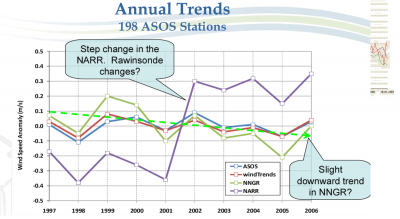
- Important Note: An issue has been reported for the NARR data when using it for long term correction purposes. A step change in the wind speeds seem to occur in the NARR data around 2002, see the figure below. The figure originates from a presentation at the US wind resource assessment workshop by Justin Sharp, Iberdrola Renewables, USA. The WindPRO team at EMD has performed its own investigations and finds a similar step change. This means that the NARR data only should be used from 2002 and onwards unless the possible step change is handled!
External Links
- Homepage for Regional Reanalysis Questions and Answers at http://www.emc.ncep.noaa.gov/mmb/rreanl
- For a detailed overview of the NARR model, please refer to the paper by F. Mesinger et al (see below). The paper may be located at the following URL: http://www.emc.ncep.noaa.gov/mmb/rreanl/.
References
- Fedor Mesinger, Geoff DiMego, Eugenia Kalnay, Kenneth Mitchell, Perry C. Shafran, Wesley Ebisuzaki, Dusan Jovic, Jack Woollen, Eric Rogers, Ernesto H. Berbery, Michael B. Ek, Yun Fan, Robert Grumbine, Wayne Higgins, Hong Li, Ying Lin, Geoff Manikin, David Parrish, and Wei Shi: North American Regional Reanalysis, Paper Submitted to the Bulletin of the AMS, 2005
- Presentation, US Wind Resource Workshop Minneapolis 2009: Long-term Wind Resource Adjustments Using Non-MCP Model Based Methodologies; Justin Sharp, Iberdrola Renewables, USA