NCEP / NCAR Global Reanalysis Data: Difference between revisions
| Line 51: | Line 51: | ||
|} | |} | ||
</center> | </center> | ||
You may learn more about these data by visiting the NCEP / NCAR web site holding the data at the URL [http://www.cdc.noaa.gov http://www.cdc.noaa.gov] or by reading the paper Kistler et al. (2001) published in Bulletin of the American Meteorological Society. The paper is available for free at: [http://www.atmos.umd.edu/~ekalnay/Kistleretal.pdf http://www.atmos.umd.edu/~ekalnay/Kistleretal.pdf]). | |||
Although the NCEP/NCAR data are simulations giving the “instantaneous values” every 6 hours, these are based on model simulation and there will be some “smoothening” compared to real measurements. We therefore recommend seeing the data as 10 min average values, although this is not specified as so in the documentation. | |||
Revision as of 14:35, 26 May 2013

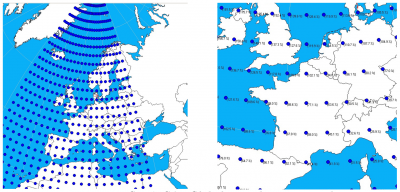
Left = Nodes Covering Western Europe. Right = Nodes Covering France.
Data from the NCEP/NCAR reanalysis project is currently available to users of WindPRO as part of the on-line services from the EMD server. A connection to the internet is thus required. Users may download updated data from the present moment (typically the preceding month) back until 1948.
The sub-set of the NCEP/NCAR Global Reanalysis Data that we hold at EMD is updated on a monthly to bi-monthly update cycle.
Data Description
The NCEP/NCAR model dataset is immense, containing a very wide range of descriptive atmospheric model data. The actual measured climate data sources used in the global reanalysis model are:
- Upperair rawinsonde observations of temperature, horizontal wind, and specific humidity (i.e. weather balloons)
- Operational Television Infrared Observation Satellite (TIROS) Operational Vertical Sounder (TOVS) vertical temperature soundings from NOAA polar orbiters over ocean, with microwave retrievals excluded between 20°N and 20°S due to rain contamination
- TOVS temperature soundings over land only above 100 hPa
- Cloud-tracked winds from geostationary satellites
- Aircraft observations of wind and temperature
- Land surface reports of surface pressure
- Oceanic reports of surface pressure, temperature, horizontal wind, and specific humidity
These data are used as input into a frozen global assimilation system and processed by a spectral model in order to provide the model output of the variables in the grid.
NCEP/NCAR Global Reanalysis Dataset at EMD
Currently, two types of NCEP/NCAR modeled wind data are available from the EMD server. Both types of data are distributed through the NCAR_Basic dataset from the EMD server. The raw data are processed by EMD as the original data holds the vector components for the wind speeds only (U and V – winds). We convert the raw data into a format appropriate for use with wind turbine applications, i.e. wind speed and direction instead.
| Name | Description |
|---|---|
| Abbreviation | srf |
| External URL | http://www.cdc.noaa.gov/cdc/data.ncep.reanalysis.surface.html |
| Data valid at time | Instantaneous values at the reference time |
| Referred to as | “Wind" at level "sig995" under main title "Surface" |
| Level | 99.5% of surface pressure (approximately 42m a.g.l. for standard atmosphere conditions) |
| Grid | 2.5 degree latitude x 2.5 degree longitude global grid (144x73) |
| Coverage | Global |
| Columns in data-file | srf.dir.2 = Wind Direction at sigma level 0.995, i.e. 42 m a.g.l srf.wsp.2 = Wind Speed at sigma level 0.995, i.e. 42 m a.g.l gl.tmp.2 = Temperature at sigma level 0.995, i.e. at 42 m a.g.l |
You may learn more about these data by visiting the NCEP / NCAR web site holding the data at the URL http://www.cdc.noaa.gov or by reading the paper Kistler et al. (2001) published in Bulletin of the American Meteorological Society. The paper is available for free at: http://www.atmos.umd.edu/~ekalnay/Kistleretal.pdf).
Although the NCEP/NCAR data are simulations giving the “instantaneous values” every 6 hours, these are based on model simulation and there will be some “smoothening” compared to real measurements. We therefore recommend seeing the data as 10 min average values, although this is not specified as so in the documentation.