Lasten - Anhang II: Frandsen Effective turbulence model
Zur deutschen Hauptseite | Alle deutschsprachigen Seiten
Der folgende Text beschreibt die wesentlichen Annahmen und Schritte der Implementation des Frandsen-Modells (Effektive Turbulenz-Modell). Die meisten Annahmen sind direkt in der IEC-Richtlinie[1][2] oder in Frandsens eigener Publikation[3] spezifiziert.
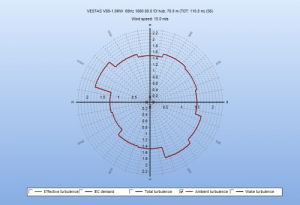
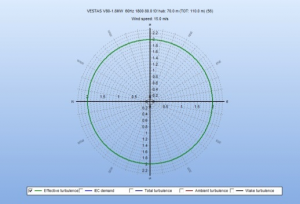
Das Frandsen-Modell[1][2][3] definiert die sogenannte Effektive Turbulenz als die Kombination der Umgebungsturbulenz mit der Nachlaufturbulenz der Nachbar-WEA. Dabei werden die Materialeigenschaften so mit einbezogen und über alle Windrichtungen integriert, dass daraus die Akkumulation der Ermüdung abgeleitet werden kann. In der IEC61400-1 Ed. 3 2010[2], wird die Effektive Turbulenz basierend auf dem 90%-Fraktil der Umgebungsturbulenz berechnet.
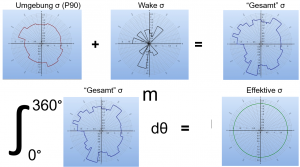
Die Abbildungen zeigen vereinfacht die Berechnungsschritte zur Ermittlung der Effektiven Turbulenz für eine WEA. m ist der Exponent der Wöhlerlinie für das Material.
Umgebungsturbulenz σ (P90) + Wake-Turbulenz σ = “Gesamt” σ
- “Gesamt” σ wird integriert zu Effektiver σ
Für die Berechnung mit dem Frandsen-Modell wird für jede WEA-Position Folgendes benötigt:
Input 1 is used to calculate the ambient characteristic turbulence, i.e. the 90th percentile.
Input 2 is used to calculate the directional wind sped distribution conditioned on wind speed.
Input 3 is used to calculate the wake generated contribution to turbulence.
Input 4 is used in the fatigue weighted combination model of single directions to obtain an omnidirectional effective turbulence as a function of wind speed only.
A main decision in SITE COMPLIANCE regarding the implementation of the Frandsen has been working directly with standard deviations of wind speed (σ) instead of turbulence intensity (TI) which is more common. There are several arguments supporting this decision. Firstly, Frandsen’s original publication[3] (p. 84) states directly that “The model is expressed in terms of standard deviation of wind speed fluctuations rather than turbulence intensity. Secondly, a fundamental assumption in Frandsen’s model is that loads are proportional to σ, the standard deviation of wind speed. Thirdly, the variation of σ with wind speed assumed in the IEC design limit (“Normal turbulence model”) is linear for (u,σ), but not for (u,TI).
The implementation of Frandsen’s model as specified in [1][2] includes on a number of assumptions and calculation steps. The main assumptions in the SITE COMPLIANCE implementation are (most are directly given in the standard[1][2]):
- “No reduction of mean wind speed inside the wind farm shall be assumed” (no wake deficit!)[1][2]
- Only wake from nearest neighbour WTG considered i wakes overlap[1][2]
- Turbulence structure correction is applied to both σ and σσ
- Wakes have a fixed angular width of 22° independent of distance[3][4]
The main steps in the calculation of effective turbulence are:
- "Total" turbulence (σT) is calculated in each direction combining measured 90th percentile of ambient turbulence (σC) and calculated wake added turbulence (σwake)[1][2] - “^” indicates measured data:
where
![]() (90th percentile of ambient turbulence)[5]
(90th percentile of ambient turbulence)[5]
and
- "Effective turbulence" is calculated from “Total turbulence” raised to the power of m (Wöhler exponent) and integrated (numerically) over all directions weighted by its relative frequency (f):
The Frandsen model requires a “large wind farm correction” when certain conditions are met, but [1][2] only considers the special case of a regular rectangular layout. In SITE COMPLIANCE a more general sector-wise version of this large wind farm correction has been implemented. For each sector the following evaluation is performed:
- If >5 neighbour WTGs in a sector, the sector is a “large wind farm sector”:
where
The latter fraction on the right in the above equation was proposed in [4] as a more generally applicable version of the fraction on the left which is given explicitly in the standard, covering only regular rectangular layouts). The square root argument represents a “thrust versus area”. In the fraction on the right the rectangular expression is replaced with an angular expression with the area of an “pie slice” A=0.5Δθd_max^2. Nsec is the number of WTGs within the “slice” or sector, dmax the radius of the slice and thus distance to the furthest neighbour WTG in the sector.
Calculation of Equivalent effective turbulence (not part of the IEC standard)
This calculation is not part of the IEC standard, but is based on considerations presented in Frandsen’s original paper[3]. The Equivalent effective turbulence is used to decide when the calculated Effective turbulence exceeds the IEC design limit to evaluate if this exceedance is critical or not. The main assumption is the same as in the Frandsen model, but an extra calculation step is added: integrating the effective turbulence over all relevant wind speeds where Frandsens model only integrates over directions. This second integration over wind speeds assumes that the sensitivity of the WTG to wind speed fluctuations is constant for the relevant wind speed range which is a significant extension to the approximation of the Frandsen model and further validation of this approximation is ongoing. The Equivalent effective turbulence is calculated as following:
Where m is Wöhler exponent, f(u) is total frequency of a wind speed bin (omnidirectional) and σeff.(u) is effective turbulence as a function of wind speed bin, i.e. the result from the Frandsen models effective turbulence calculation.
The effective turbulence result for a particular WTG is compared the IEC design limit for the WTG class by calculating the equivalent effective turbulence for the relevant IEC design class (turbulence and frequency values) and for the actual WTG results. These results for the actual WTG result are normalized by the result for the IEC class. If the normalized result (ratio) exceeds 1 the IEC exceedance is considered critical. The integration limits are set to match the IEC check interval.
Referenzen:
- ↑ 1.0 1.1 1.2 1.3 1.4 1.5 1.6 1.7 1.8 1.9 IEC 61400-1 ed. 3, 2005, Wind turbines – Part 1: Design requirements
- ↑ 2.00 2.01 2.02 2.03 2.04 2.05 2.06 2.07 2.08 2.09 2.10 IEC 61400-1 ed. 3, 2010, Amendment 1
- ↑ 3.0 3.1 3.2 3.3 3.4 Frandsen, S. T., 2007, Turbulence and turbulence generated loading in wind turbine clusters, Risø report R-1188
- ↑ 4.0 4.1 Nielsen, M., Jørgensen, H. E. and Frandsen, S. T., 2009, Wind and wake models for IEC 61400-1 site assessment, Proceedings of the European Wind Energy Conference (EWEC 2009)
- ↑ For complex terrain σC is multiplied by the Turbulence Structure Correction Parameter, CCT
| SITE COMPLIANCE & LOAD RESPONSE |
|---|
| SITE COMPLIANCE: Überblick ♦ Schritt-für Schritt ♦ Berechnung ♦ Ergebnisse |
| Hauptprüfungen: Komplexität ♦ Extremwind ♦ Turbulenz ♦ Windverteilung ♦ Windshear ♦ Neigung der Anströmung♦ Luftdichte |
| Andere Prüfungen: Erdbebenrisiko ♦ Temperaturbereich ♦ Blitzrate |
| LOAD RESPONSE: Überblick ♦ Berechnung ♦ WEA-Modelle ♦ Ergebnisse |
| Anhang: Gumbel Theory of Extremes ♦ Frandsen-Modell ♦ Grenzen in SITE COMPLIANCE ♦ Theorie Ermüdungslasten ♦ Sektormanagement ♦ IEC 61400-1 Ed.2 ♦ IEC 61400-1 Ed.4 ♦ Weiterbetrieb ♦ Siteres ♦ Tropical Cyclone Analysis ♦ Downscaling, Offshore-Modus & Spektralkorrektur |


